Find an office location
More than 175 offices from coast to coast.

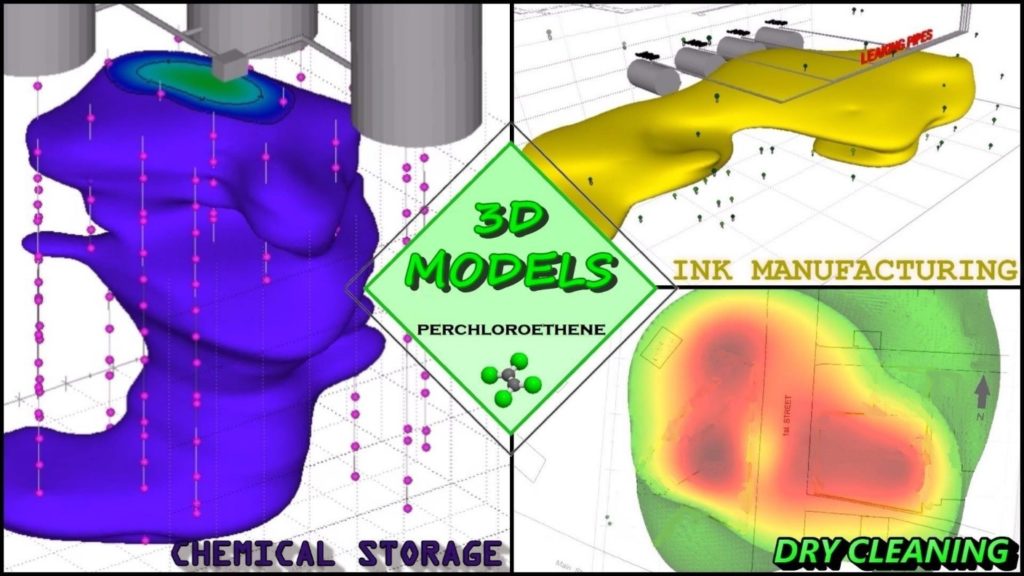
Figure 1: 3-D Models Showing Perchloroethene (PCE) Contamination in Soil from Three Environmental Investigations
Using state-of-the-art 3-D Visualization and Animation (3-DVA) technology, Terracon has the ability to visualize and model data in three dimensions, as well as create interactive animations of the models, allowing data to be viewed from multiple perspectives or even from different periods of time. The 3-D models have saved money during environmental investigations by accurately estimating the amount of contamination in the subsurface, have helped to determine where to collect additional data, and have been used to design more efficient remediation systems. Animations of the models can present data in innovate ways to clients, demonstrate the progress of site clean-ups to regulatory agencies, and are a game-changing tool in environmental litigation.
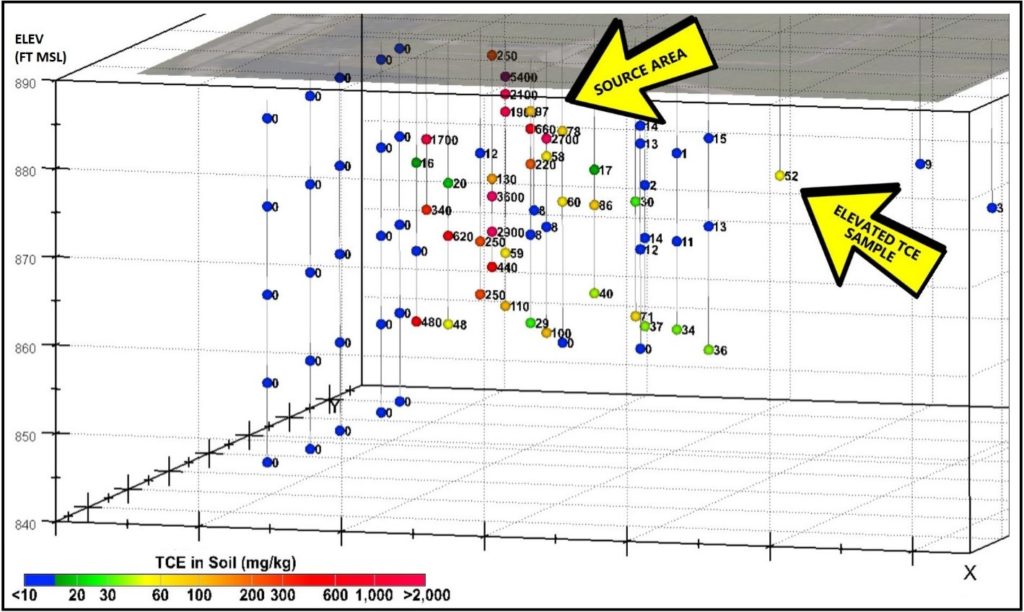
3-DVA technology’s most basic tool allows for the viewing of data from boring logs or laboratory analytical reports in three dimensions. Simple 3-D visualizations can reveal spatial relationships about the data that are not as readily apparent when viewed in 2-D graphs. The image in Figure 2 depicts more than 90 soil sample locations collected during a subsurface environmental investigation performed by Terracon involving a spill of trichloroethene (TCE). TCE is an industrial solvent used in many manufacturing operations, primarily as a metal degreaser, but is also a suspected carcinogen and one of the most common groundwater contaminants encountered during environmental investigations. The 3-D visualization helped to identify and assess the suspected source of the TCE contamination revealing a sample location with an elevated TCE concentration located nearly 100 feet away from the source and at 20 feet in depth, indicating that further investigation was warranted.

Figure 2: A 3-D Visualization of Soil Sample Locations with Color-Coded Analytical Data
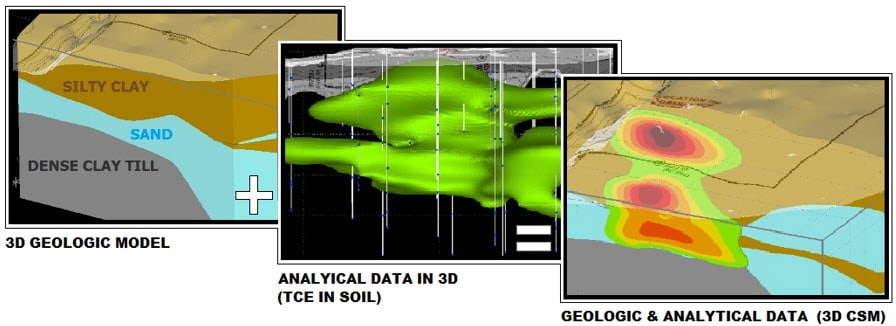
Using statistics, 3-DVA technology can create accurately scaled 3-D models from a wide variety of geological, chemical, or geophysical data. The models can represent geologic units, groundwater surfaces, or the volumes of impacted soil or groundwater. The image in Figure 3 depicts the creation of a 3-D conceptual site model from an environmental investigation performed by Terracon. The model identified three major geologic units (built from boring logs), identified the horizontal and vertical extent of the contamination (created from soil analytical data), and provided information on how the contamination migrated through the geologic units in the subsurface.
The 3-D model was included in the remedial design report and was accepted by the US Environmental Protection Agency (EPA). The model was also provided to remediation contractors and was used to design a more effective and efficient (and less expensive) treatment system. 3-D models from other Terracon projects have been used to estimate the amount of contaminated soil needing to be removed for an excavation and estimate the in-situ mass of contamination for on-site treatment.

Figure 3: Creation of a 3-D Conceptual Site Model (3-D CSM) from Borings Logs and Analytical Data
We’re only scratching the surface of what 3-DVA has been able to accomplish. Terracon has used the technology on more than 60 environmental investigation and remediation projects to:

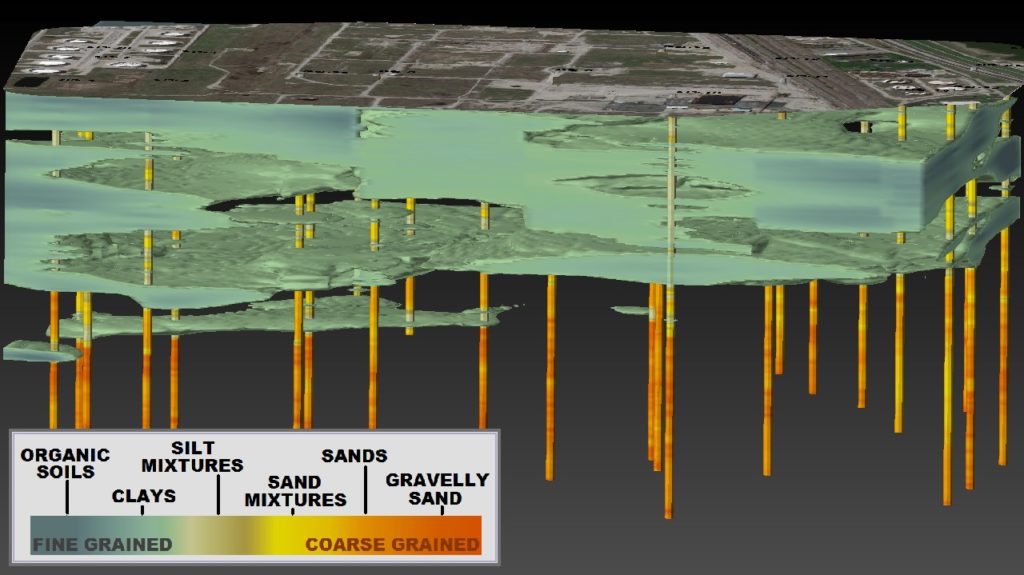
Figure 4: A High-Resolution 3-D Geologic Model Created from Cone Penetrometer Test Results (The Fine-Grained Soils are Shown in Teal and Gray)
To take full advantage of 3-DVA technology, animations can be produced from the 3-D models, allowing data to be viewed from multiple angles and perspectives, or over time. Two different types of animations can be created. The first type plays like a movie, allowing the user to play, pause, or rewind without needing any additional software other than a media player. The second type, called a 4DIM, allows the user to rotate the model and zoom in and out to identify key points of interest. Several animations produced by Terracon have proven to be valuable tools in environmental litigations, providing a visual explanation of complex geologic and hydrogeologic concepts to attorneys, jurors, and others outside the scientific community.
More than 175 offices from coast to coast.